
Python Pandas Project
#import libraries
import numpy as np
import pandas as pd
#Create a dataframe
df=pd.read_csv("top-5000-youtube-channels.csv")
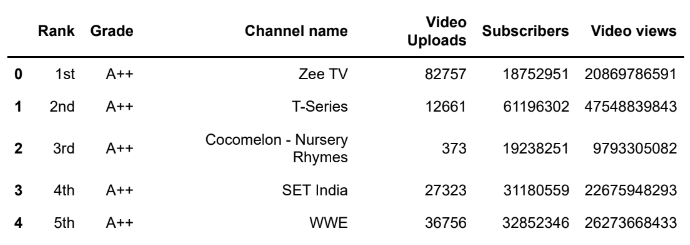
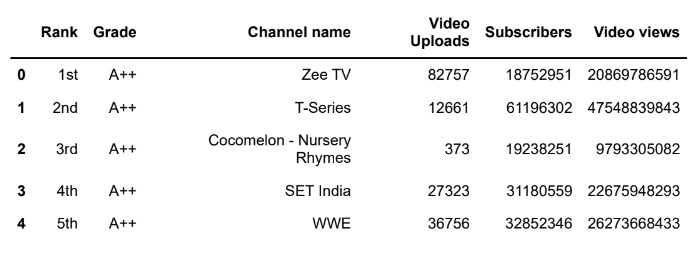
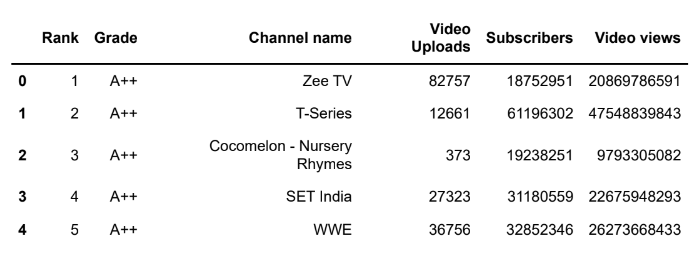
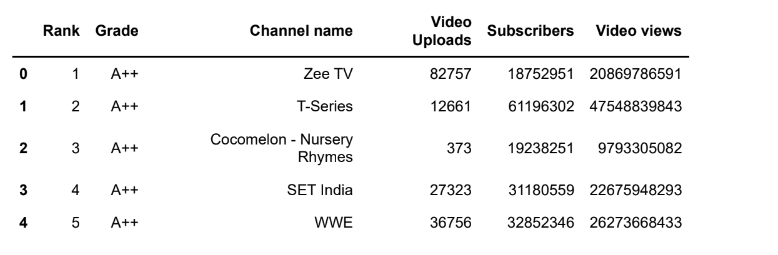
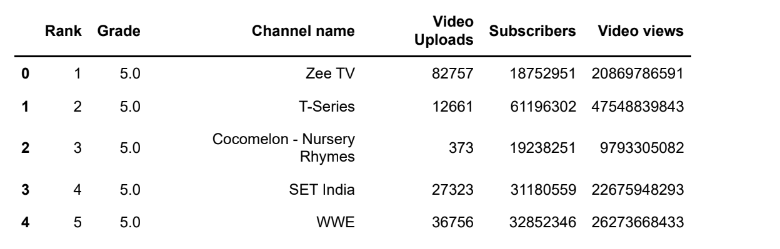
df.head()Output:
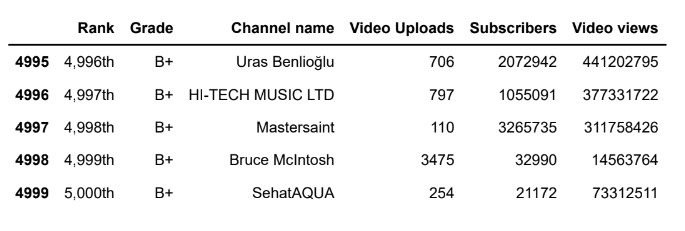
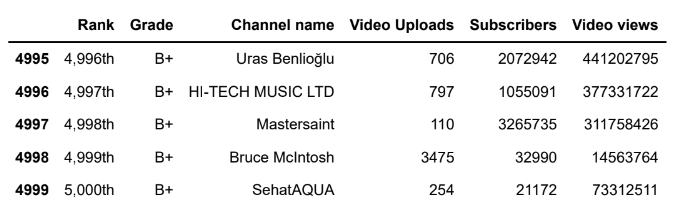
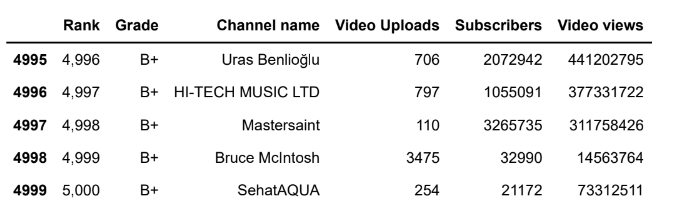
df.tail()Output:
#display all rows except the last 5 rows
df.head(-5)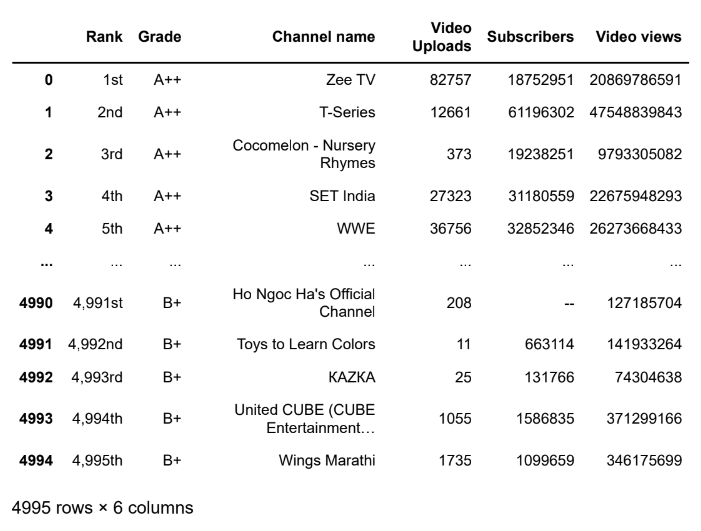
#display all rows except the first 5 rows
df.tail(-5)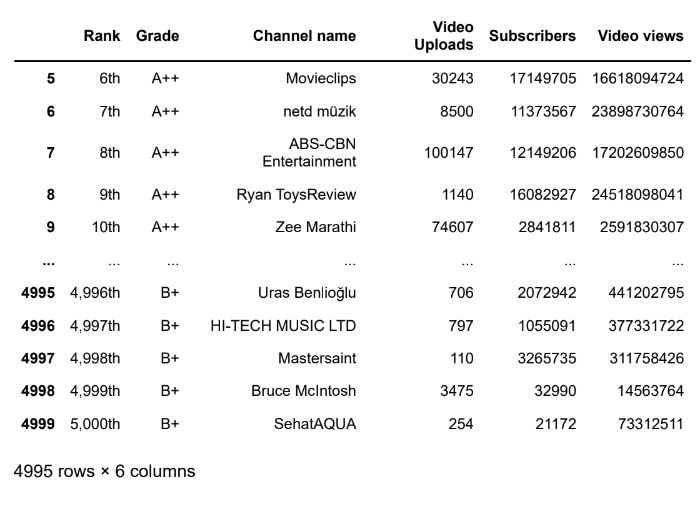
#Get the no. of rows and no. of columns
df.shape
Output: (5000, 6)
print("the no. of rows:",df.shape[0])
print("the no. of columns:",df.shape[1])
the no. of rows: 5000
the no. of columns: 6
#To get iformation about the dataframe like total no. of rows, total no
# of each column and memory requiremnets
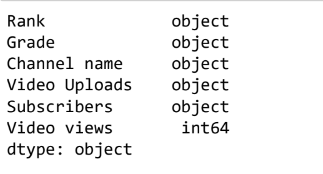
df.info()<class 'pandas.core.frame.DataFrame'>
RangeIndex: 5000 entries, 0 to 4999
Data columns (total 6 columns):
# Column Non-Null Count Dtype
--- ------ -------------- -----
0 Rank 5000 non-null object
1 Grade 5000 non-null object
2 Channel name 5000 non-null object
3 Video Uploads 5000 non-null object
4 Subscribers 5000 non-null object
5 Video views 5000 non-null int64
dtypes: int64(1), object(5)
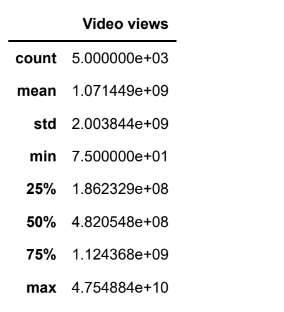
memory usage: 234.5+ KB#Get all statistics of dataframe
df.describe()Output:
df.describe().T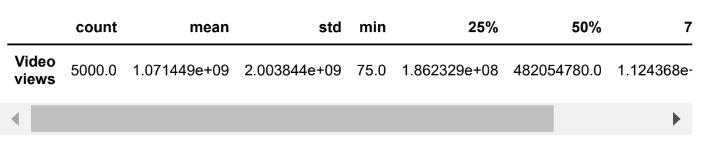
#Check null values
df.isnull().sum()
Output:
Rank 0
Grade               0
Channel name        0
Video Uploads       0
Subscribers         0
Video views         0
dtype: int64
#Data cleaning[Rank Column]
df.head()Output:
df.tail()Output:
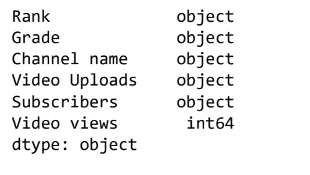
df.dtypesOutput:
df.columnsOutput:
Index(['Rank', 'Grade', 'Channel name', 'Video Uploads', 'Subscribers', 'Video views'], dtype='object')
df['Rank']=df['Rank'].str[0:-2]df.head()Output:
df.tail()Output:
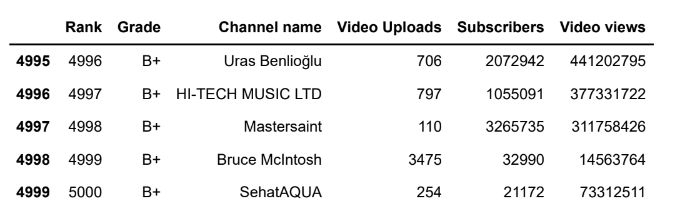
df['Rank']=df['Rank'].str.replace(',','')df.tail()Output:
df.dtypesOutput:
# Data cleaning ['Video Uploads' & 'Subscribers']
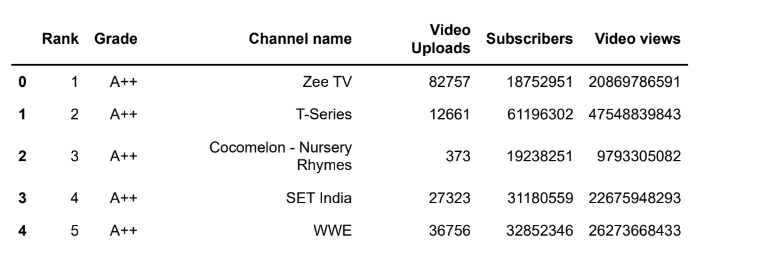
df.head()Output:
df.dtypesOutput:
df.columnsOutput:
Index(['Rank', 'Grade', 'Channel name', 'Video Uploads', 'Subscribers', 'Video views'], dtype='object')
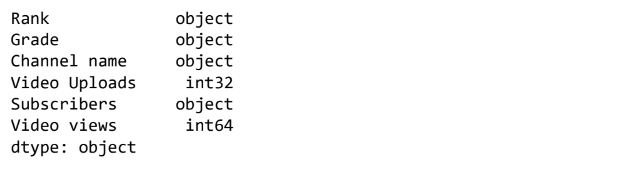
df['Video Uploads']=df['Video Uploads'].replace('--').astype('int')df.dtypesOutput:
# Data Cleaning(Grade)
df.head()
Output:
df['Grade']=df['Grade'].map({'A++ ':5,'A+ ':4,'A ':3,'A- ':2,'B+ ':1})df.head()Output:
df.dtypes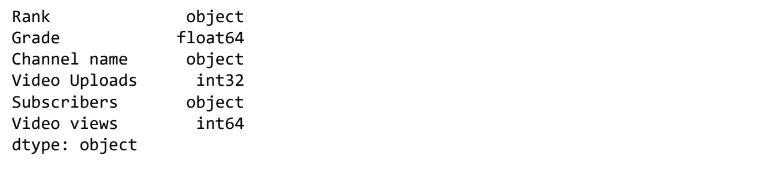
#Find average views for each channel
df.columns
Output:
Index(['Rank', 'Grade', 'Channel name', 'Video Uploads', 'Subscribers', 'Video views'], dtype='object')
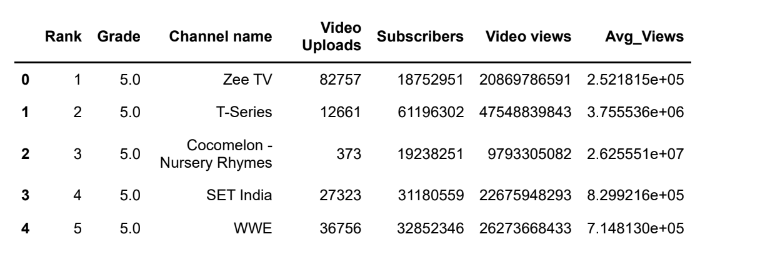
df['Avg_Views']=df['Video views']/df['Video Uploads']df.head()Output:
#Find top 5 channels with maximum number of video uploads
df.columns
Output:
Index(['Rank', 'Grade', 'Channel name', 'Video Uploads', 'Subscribers', 'Video views', 'Avg_Views'], dtype='object')
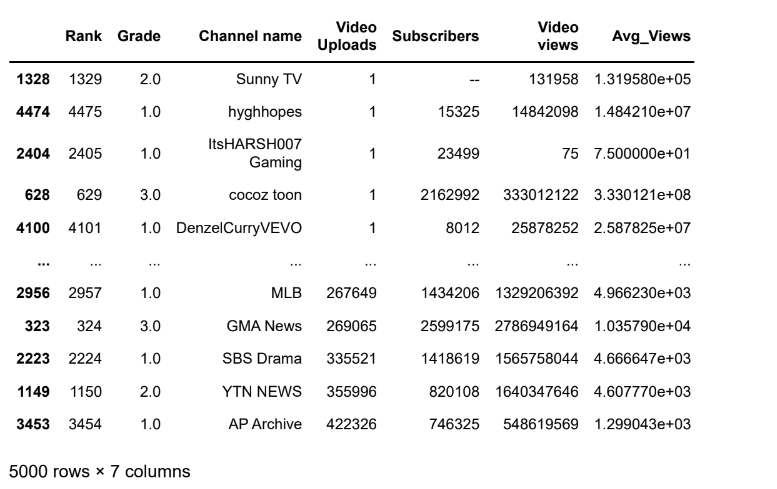
df.sort_values(by='Video Uploads')Output:
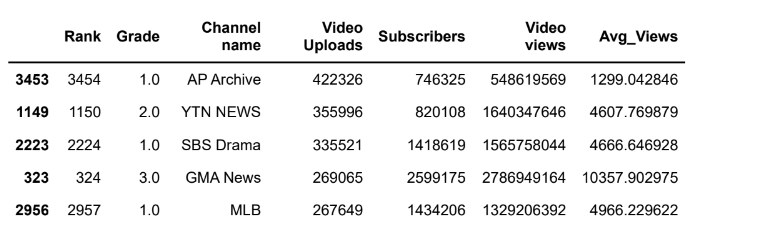
df.sort_values(by='Video Uploads',ascending=False).head()Output:
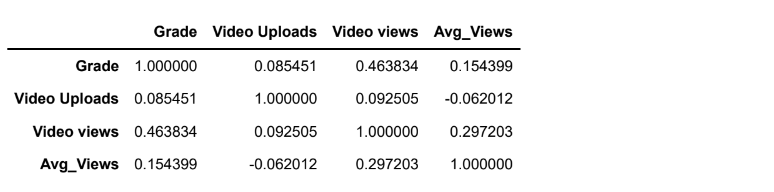
#Find corelation matrix
df.corr()
Output:
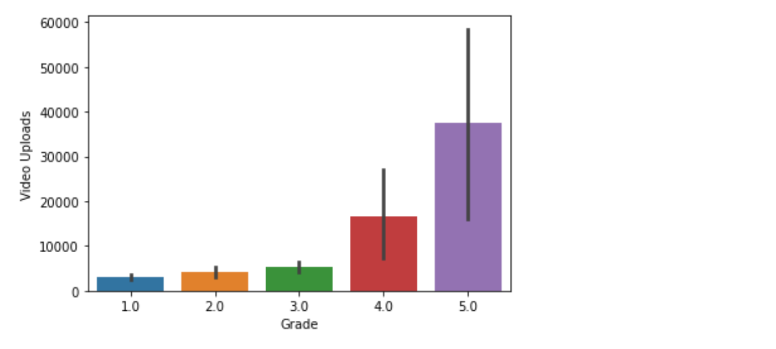
#Which grade has maximum no of video uploads
df.columns
Output:
Index(['Rank', 'Grade', 'Channel name', 'Video Uploads', 'Subscribers', 'Video views', 'Avg_Views'], dtype='object')
import seaborn as sns
sns.barplot(x='Grade',y='Video Uploads',data=df)
Output: <AxesSubplot:xlabel='Grade', ylabel='Video Uploads'>
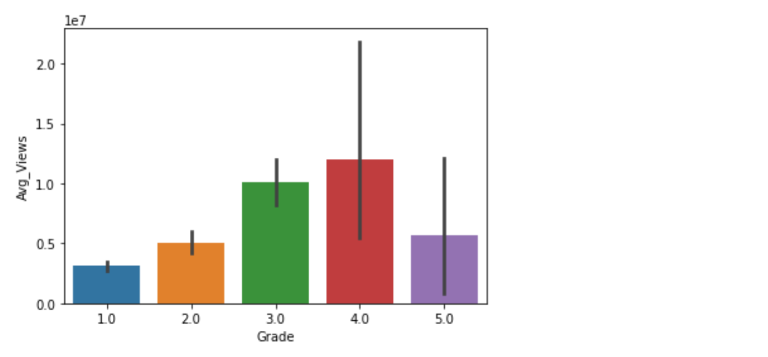
#Which grade has the highest average views
df.columns
Output:
Index(['Rank', 'Grade', 'Channel name', 'Video Uploads', 'Subscribers', 'Video views', 'Avg_Views'], dtype='object')
sns.barplot(x='Grade',y='Avg_Views',data=df)Output: <AxesSubplot:xlabel='Grade', ylabel='Avg_Views'>
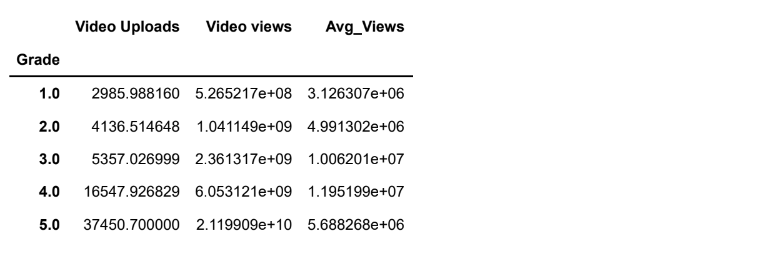
#Which grade has the highest video views
df.groupby('Grade').mean()
Output:
About the Author

Silan Software is one of the India's leading provider of offline & online training for Java, Python, AI (Machine Learning, Deep Learning), Data Science, Software Development & many more emerging Technologies.
We provide Academic Training || Industrial Training || Corporate Training || Internship || Java || Python || AI using Python || Data Science etc