

Heart Disease Prediction using Logistic Regression
Machine Learning has become a cornerstone of modern technology applications worldwide.
In healthcare, it can play a pivotal role in aiding physicians with quicker and more accurate diagnoses.
In this article, we focus on the Heart Disease dataset to predict patient outcomes—whether they have heart disease or are normal.
This approach promises to make healthcare more efficient by reducing the time required for diagnoses.
#Import libraries
import numpy as np
import pandas as pd
import matplotlib.pyplot as plt
import seaborn as sns
Dataset Link: https://www.kaggle.com/datasets/johnsmith88/heart-disease-dataset
#Load the dataset
df=pd.read_csv("heart.csv")
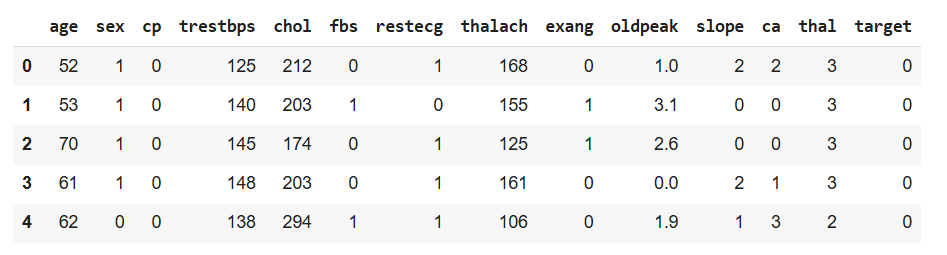
df.head()
Output:
#To get no. of rows and columns
df.shape
Output:
(1025, 14)
#To get no. of rows and columns
df.info()
< class 'pandas.core.frame.DataFrame'>
RangeIndex: 1025 entries, 0 to 1024
Data columns (total 14 columns):
# Column Non-Null Count Dtype
--- ------ -------------- -----
0   age       1025 non-null   int64
1   sex       1025 non-null   int64
2   cp        1025 non-null   int64
3   trestbps  1025 non-null   int64
4   chol      1025 non-null   int64
5   fbs       1025 non-null   int64
6   restecg   1025 non-null   int64
7   thalach   1025 non-null   int64
8   exang     1025 non-null   int64
9   oldpeak   1025 non-null   float64
10  slope     1025 non-null   int64
11  ca        1025 non-null   int64
12  thal      1025 non-null   int64
13  target    1025 non-null   int64
dtypes: float64(1), int64(13)
memory usage: 112.2 KB
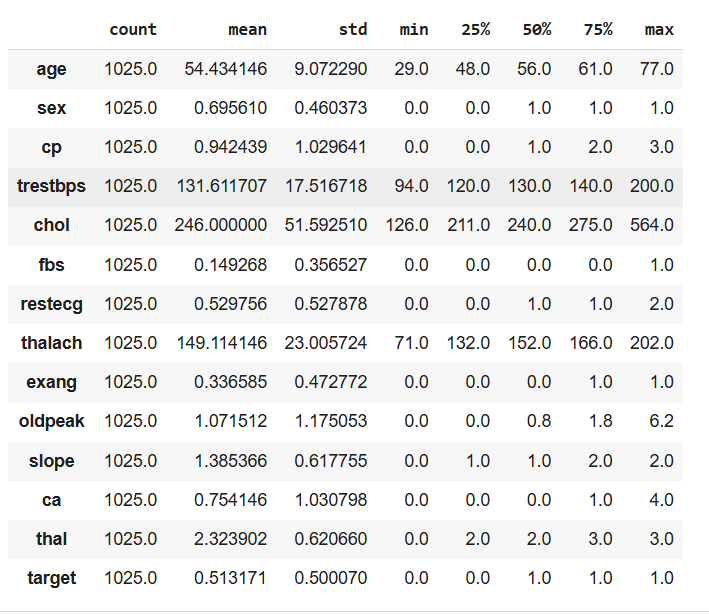
#To get the detail statistical information about dataframe
df.describe().T
#checking missing values
df.isnull().sum()
Output:
age      0
sex      0
cp       0
trestbps 0
chol     0
fbs      0
restecg  0
thalach  0
exang    0
oldpeak  0
slope    0
ca       0
thal     0
target   0
dtype: int64
#create a heatmap taking co-relation matrix
plt.figure(figsize=(15,10))
sns.heatmap(df.corr(),linewidth=.01, annot=True, cmap="winter")
plt.show()
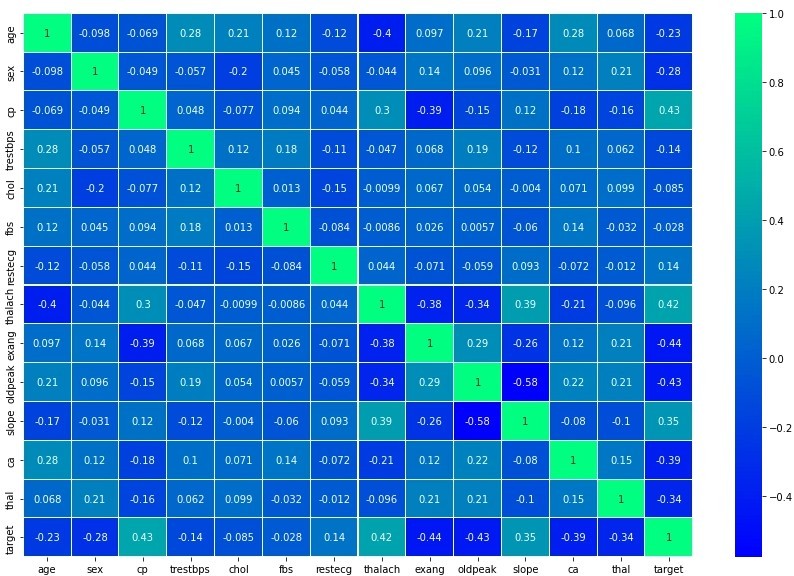
From the above heatmap, we are observing that CP and target have a positive correlation. That means who has a large risk of chest pain results in a greater chance to have heart disease.
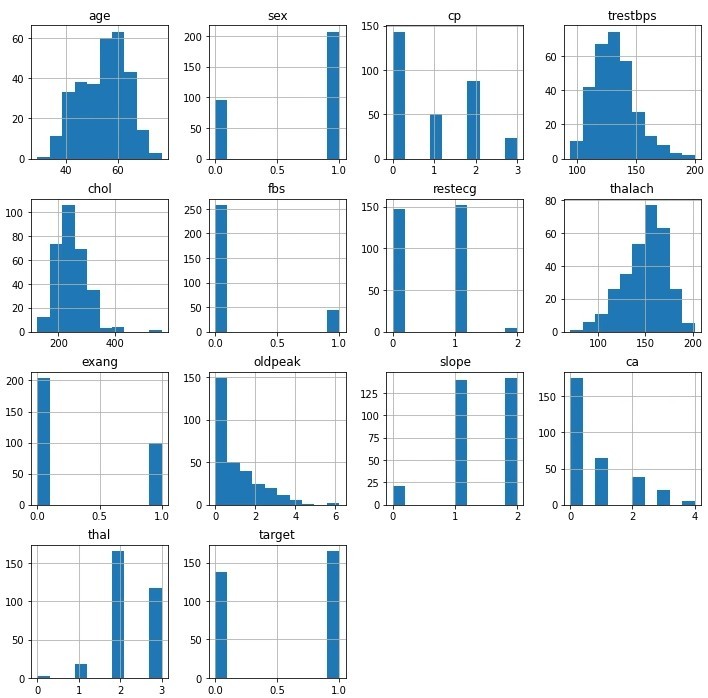
df.hist(figsize=(12,12))
plt.show()
#Choose X and y [X: input variables, y: output variable]
X=df.iloc[:,:-1]
y = df.iloc[:, -1]
#Split dataset into training and testing data
from sklearn.model_selection import train_test_split
X_train,X_test,y_train,y_test=train_test_split(X, y, test_size=0.25, random_state=42)
X_test
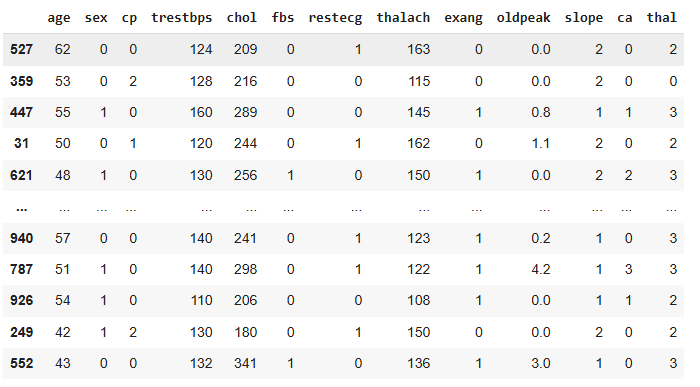
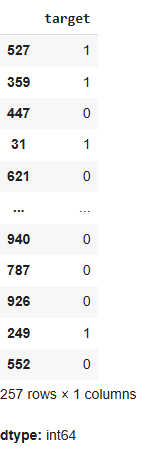
y_test
#Create a Logistic Regression Model
from sklearn.linear_model import LogisticRegression
model=LogisticRegression()
#trained the model
model.fit(X_train,y_train)
#Model prediction over X_test data
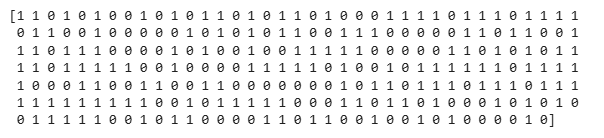
y_prediction=model.predict(X_test)
print(y_prediction)
#To get the accuracy
from sklearn.metrics import accuracy_score
print(accuracy_score(y_test,y_prediction))
Output:
0.8054474708171206
#Model Implementation
input=(62,0,0,124,209,0,1,163,0,0.0,2,0,2)
arr=np.asarray(input)
#print(arr)
arr_reshaped=arr.reshape(1,-1)
#print(arr_reshaped)
pred1=model.predict(arr_reshaped)

if(pred1==1):
  print("patient having heart disease")
else:
  print("patient having no heart disease")
Output:
patient having heart disease
About the Author

Silan Software is one of the India's leading provider of offline & online training for Java, Python, AI (Machine Learning, Deep Learning), Data Science, Software Development & many more emerging Technologies.
We provide Academic Training || Industrial Training || Corporate Training || Internship || Java || Python || AI using Python || Data Science etc


PreviousNext
Join our newsletter for the latest updates.
About us
Our Services
Contact Us
Our Courses
Learn Python | Learn AI | Learn Machine Learning | Learn Deep Learning | Learn Core Java | Learn Java JSP | Learn Java Servlet | Learn Java Spring Core | Learn Spring Boot | Learn Power BI | Learn DAA | Learn HTML | Learn SQL | Learn C Programming | Learn Bootstrap | Learn Git | Learn JavaScript | Learn Data Structure Using C | Learn RDBMS | Learn Data Science | Learn PHP
Our Tutorials
Python Tutorial | AI Tutorial | Machine Learning Tutorial | Deep Learning Tutorial | Core Java Tutorial | Java JSP Tutorial | Java Servlet Tutorial | Java Spring Tutorial | Spring Boot Tutorial | Power BI Tutorial | DAA Tutorial | HTML Tutorial | SQL Tutorial | C Programming Tutorial | Bootstrap Tutorial | Git Tutorial | JavaScript Tutorial | Data Structure Using C Tutorial | RDBMS Tutorial | Data Science Tutorial | PHP Tutorial
Copyright © 2023 Pythontpoint Powered by Silan Software Pvt. Ltd. All rights reserved.