

Confusion Matrix & Cost Matrix
Confusion & Cost Matrix helps in calculating the accuracy, cost and various other measurable factors in classification problem.
Confusion matrix:
A Confusion matrix is an N x N matrix used for evaluating the performance of a classification model, where N is the number of target classes. The matrix compares the actual target values with predicted values which are predicted by machine learning model.
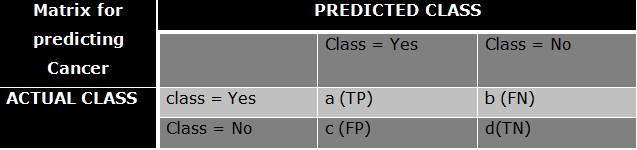
a) True +ve: If the person is actually having cancer (Actual class = Yes) and we predict It correctly as Yes he is actually having a cancer (Predicted Class = Yes)
b) False -ve: If the person is actually having a cancer(Actual class = Yes) and we predict wrong as No, he is actually having a cancer (Predicted class = No)
c) False +ve: if the person is not having a cancer (Actual class = No) and we predict as Yes,he is actually not having cancer but we predict as he is having cancer, which is wrong (Predicted class = Yes)
d) True -ve: If the person is not having a cancer (Actual class = No) and we predict correctly as No, that means we predict correctly as the person is not having cancer (Predicted Class = No)
Confusion Metrics is used for evaluating the performance of the model classification problem.
We can calculate the Accuracy from the confusion matrix as follows:
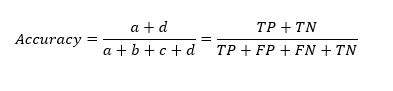
We always need percentage of TP and TN to be maximum, since these are correct predictions. The percentage of FP and FN needs to be minimum, since these are wrong predictions, so that the model is accurate or we can say accuracy is high.
We can also call Accuracy as = Total Number of Correct predictions / Total Number of observations
Total Number of Correct predictions = TP + TN
Total Number of observations = TP + FP + FN + TN
Accuracy is always calculated in terms of percentage (0% to 100%) and in terms of fraction (0 to 1). Closer to 1 in terms of fraction is said to be better model.
However there are some Limitations of Accuracy:
Limitations of Accuracy
Let us consider a 2-class problem (0 and 1), Suppose we are having below scenario:
Number of Class 0 examples = 99900
Number of Class 1 examples = 100
If the model predicts everything to be class 0, then
Accuracy is 99900 + 0/100000 = 99.9 %
Accuracy in this case will be misleading because model does not detect any class 1 example.
In this case we get accuracy as 99.9% but we cannot evaluate the performance of a model on the basis of accuracy because we were not able to predict class 1 examples.
If we see carefully the proportion of Class 0 examples is high which is 9990 and the proportion of class 1 examples is very low which is 10 for the 2-class problem.
Hence in the above case accuracy will not be a correct measure to evaluate the performance of model.
In this case we need to check ROC etc.
Cost Matrix:
The cost matrix is like a confusion matrix without the fact that we calculate the cost of incorrect predictions or incorrect predictions. A Cost Matrix is a method for adjusting the weight assigned to misclassifications by Credit Scoring Models in particular supervised models. The cost matrix offers a means to differentiate the importance of Type I and Type II classification errors.
For machine-learning classification models, the cost matrix is the most common approach for reducing specific types of classification error. This matrix is an array of numbers organized in columns and rows, and each number specifies a cost for each outcome in the confusion matrix.
Example: Let's take an example of a model used to predict a person with or without cancer (see below)
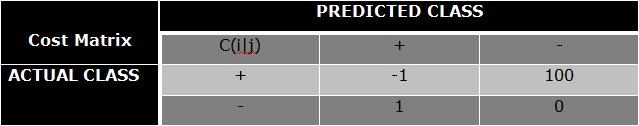
Scenario (1): A person with cancer is predicted to have no cancer and So what do you think will be the cost of incorrect prediction?
Obviously in both cases the costs will be involved
Case (1) will be more expensive compared to Case (2): Because a person with cancer is predicted to have no cancer, they will not be given cancer treatment, which is why they are more likely to die.
As in case (2) a person who does not have cancer is diagnosed with cancer, he or she will be given cancer treatment / treatment but will eventually be discharged if we know he or she does not have cancer.
So in both cases costs are involved, however Case (1) will be more expensive compared to Case (2), as there is a higher risk of Case Case (1) patient dying. So not all bad predictions will have the same cost. A certain weight should be taken.
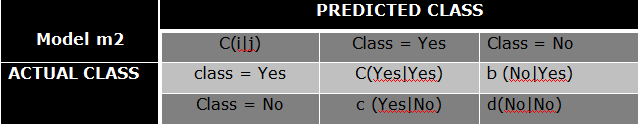
There are two models namely Model M1 and M2 both with correct predictions and incorrect predictions. When we compare both models and when we check their accuracy. The accuracy of the Model M2 is higher compared to the Model M1, however the cost of the Model M2 is higher compared to the Model M1. So it depends on what kind of problem we are facing in the statement.
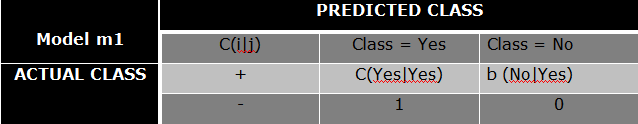
If we focus on accuracy then we will go with Model M2 (In this case we need to lower the cost), however if we focus on cost we will go with Model M1 (In this case we need to compromise accuracy).
Computing Cost of Classification Problem
Other Cost Sensitive Measures:
Precision (p) = a/a+c
Recall (r) = a/a+b
F-measure (F) = 2a/2a +b+c
More meausers:
True positive rate (TPR) (Sensitivity)
TPR = a/a+b (Sensitivity)
True Negative rate (TNR)(Specificity)
TNR = d/c+d (Specificity)
False Positive rate (FPR)
FPR = c/c+d
False Negative rate (FNR)
FNR = b/a+b
About the Author

Silan Software is one of the India's leading provider of offline & online training for Java, Python, AI (Machine Learning, Deep Learning), Data Science, Software Development & many more emerging Technologies.
We provide Academic Training || Industrial Training || Corporate Training || Internship || Java || Python || AI using Python || Data Science etc


PreviousNext
Join our newsletter for the latest updates.
About us
Our Services
Contact Us
Our Courses
Learn Python | Learn AI | Learn Machine Learning | Learn Deep Learning | Learn Core Java | Learn Java JSP | Learn Java Servlet | Learn Java Spring Core | Learn Spring Boot | Learn Power BI | Learn DAA | Learn HTML | Learn SQL | Learn C Programming | Learn Bootstrap | Learn Git | Learn JavaScript | Learn Data Structure Using C | Learn RDBMS | Learn Data Science | Learn PHP
Our Tutorials
Python Tutorial | AI Tutorial | Machine Learning Tutorial | Deep Learning Tutorial | Core Java Tutorial | Java JSP Tutorial | Java Servlet Tutorial | Java Spring Tutorial | Spring Boot Tutorial | Power BI Tutorial | DAA Tutorial | HTML Tutorial | SQL Tutorial | C Programming Tutorial | Bootstrap Tutorial | Git Tutorial | JavaScript Tutorial | Data Structure Using C Tutorial | RDBMS Tutorial | Data Science Tutorial | PHP Tutorial
Copyright © 2023 Pythontpoint Powered by Silan Software Pvt. Ltd. All rights reserved.